Audiology Progress Slope Chart
Audiology Progress Slope Chart is a working Excel spreadsheet for clinicians and school teams. You enter your data once and every total, chart and date keeps itself current. It opens in Microsoft Excel and in Google Sheets, has no macros and nothing to install, and is reusable every school year.
What it does
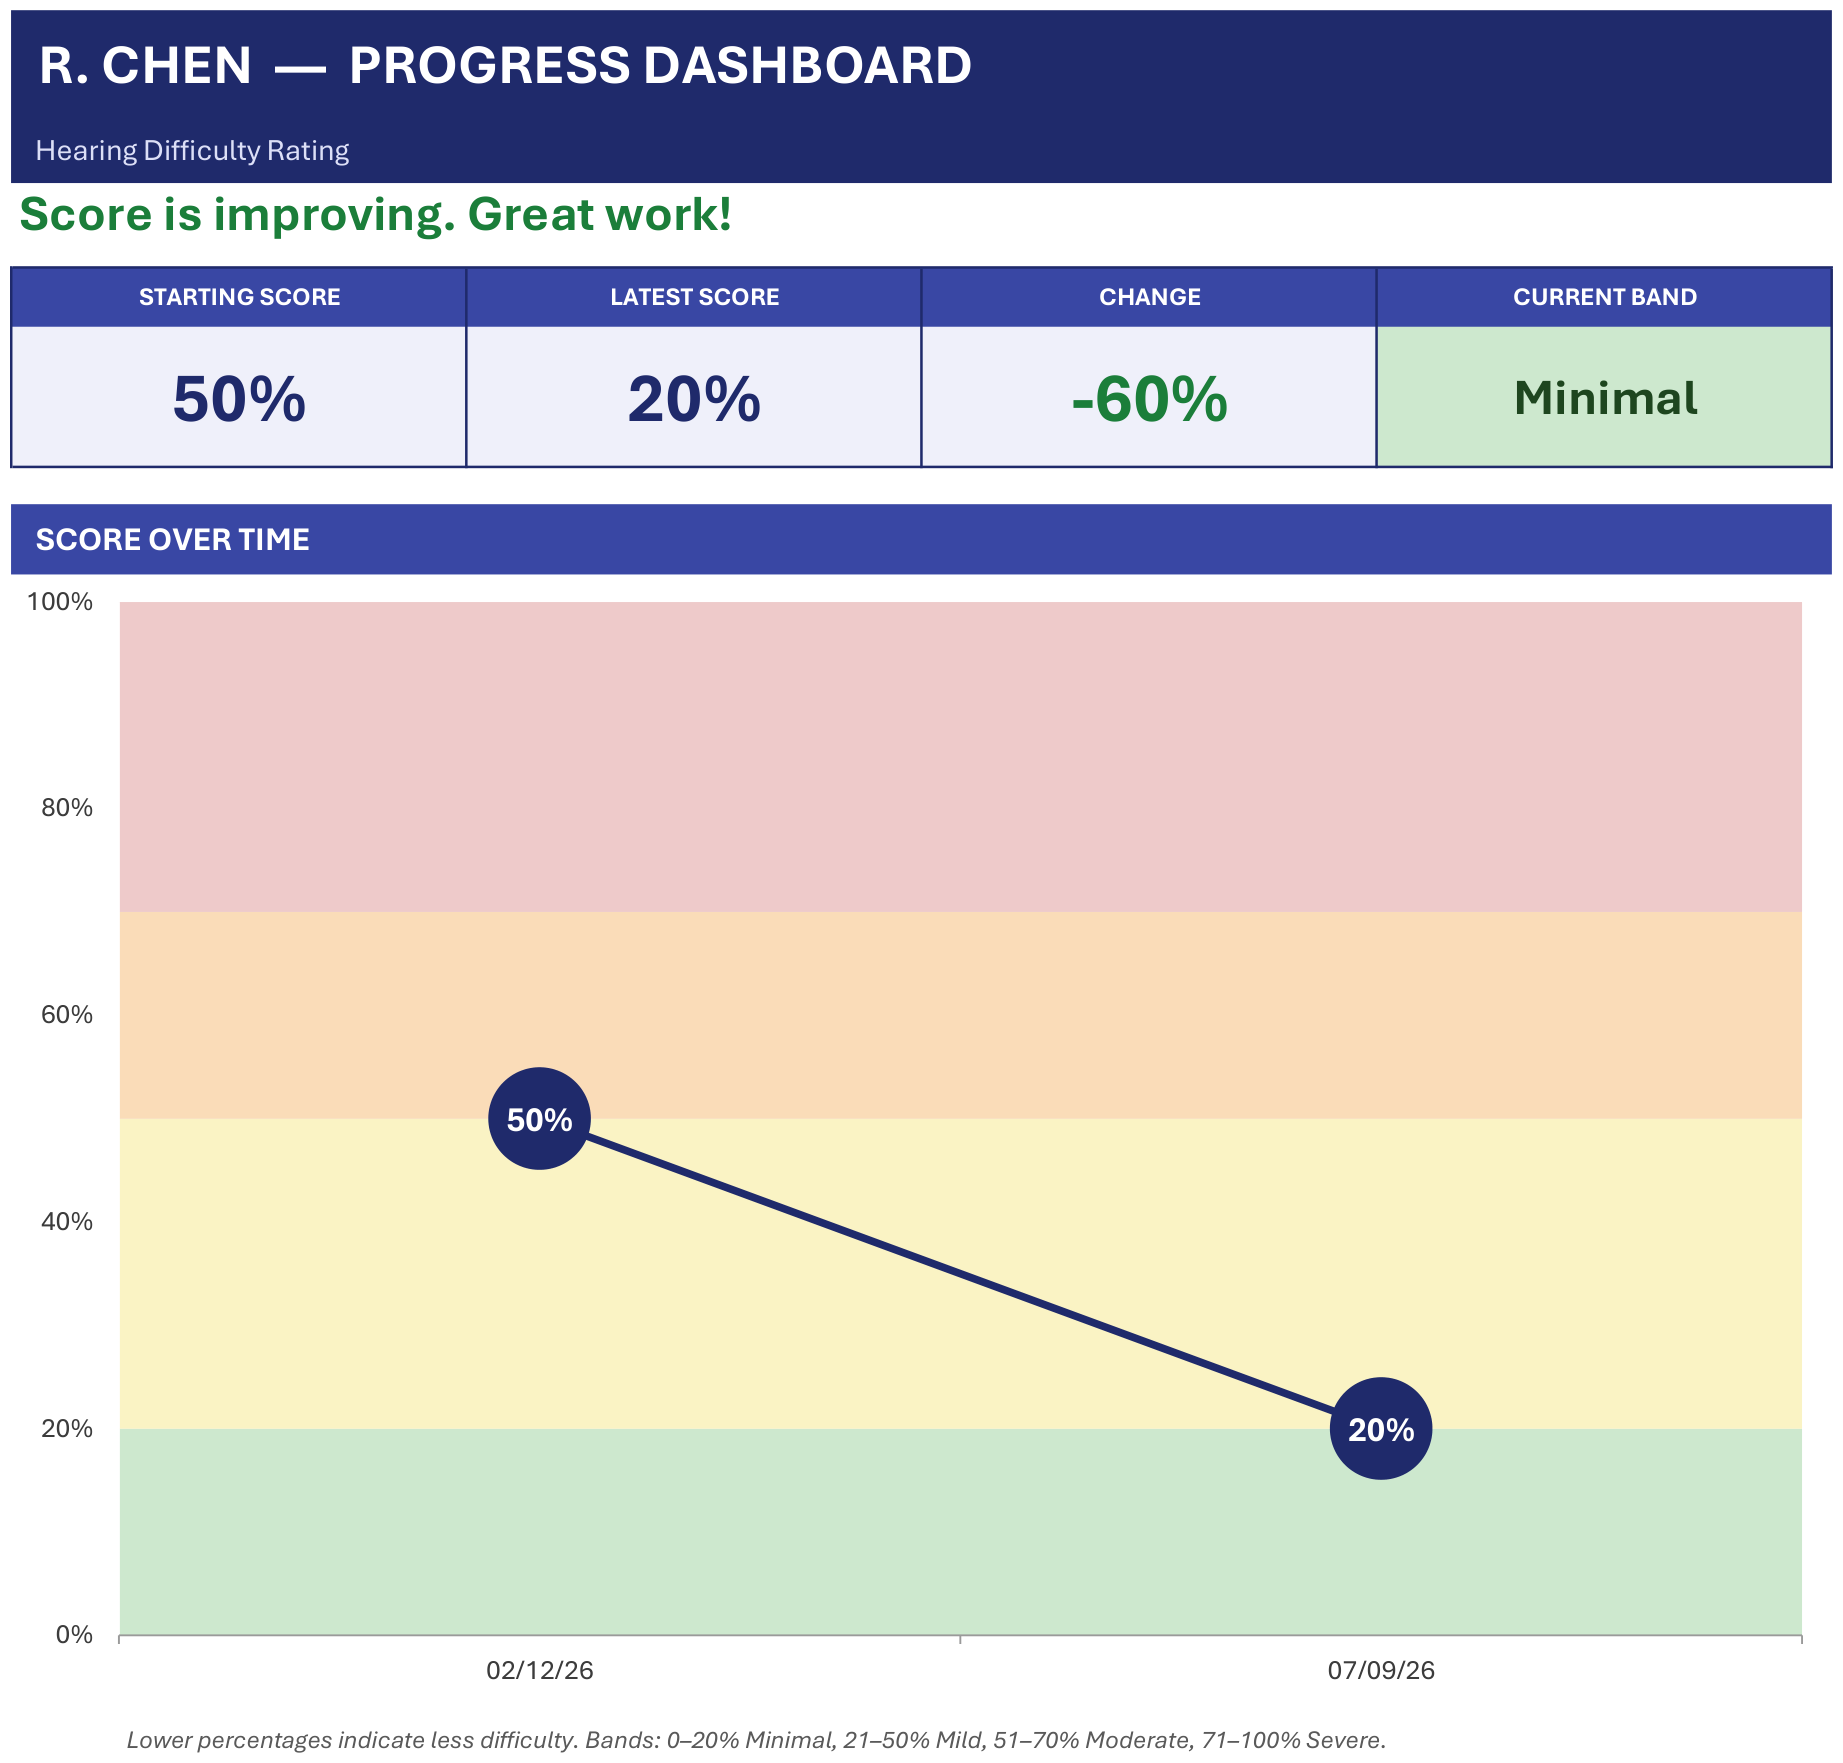
- A two-point slope chart that plots your earliest and most recent flagged session, so progress reads at a glance instead of as a wall of numbers
- Four colour-coded score bands behind the line, labelled in your profession's own language
- Log as many sessions as you like — the chart follows the first and latest automatically, even if dates are entered out of order
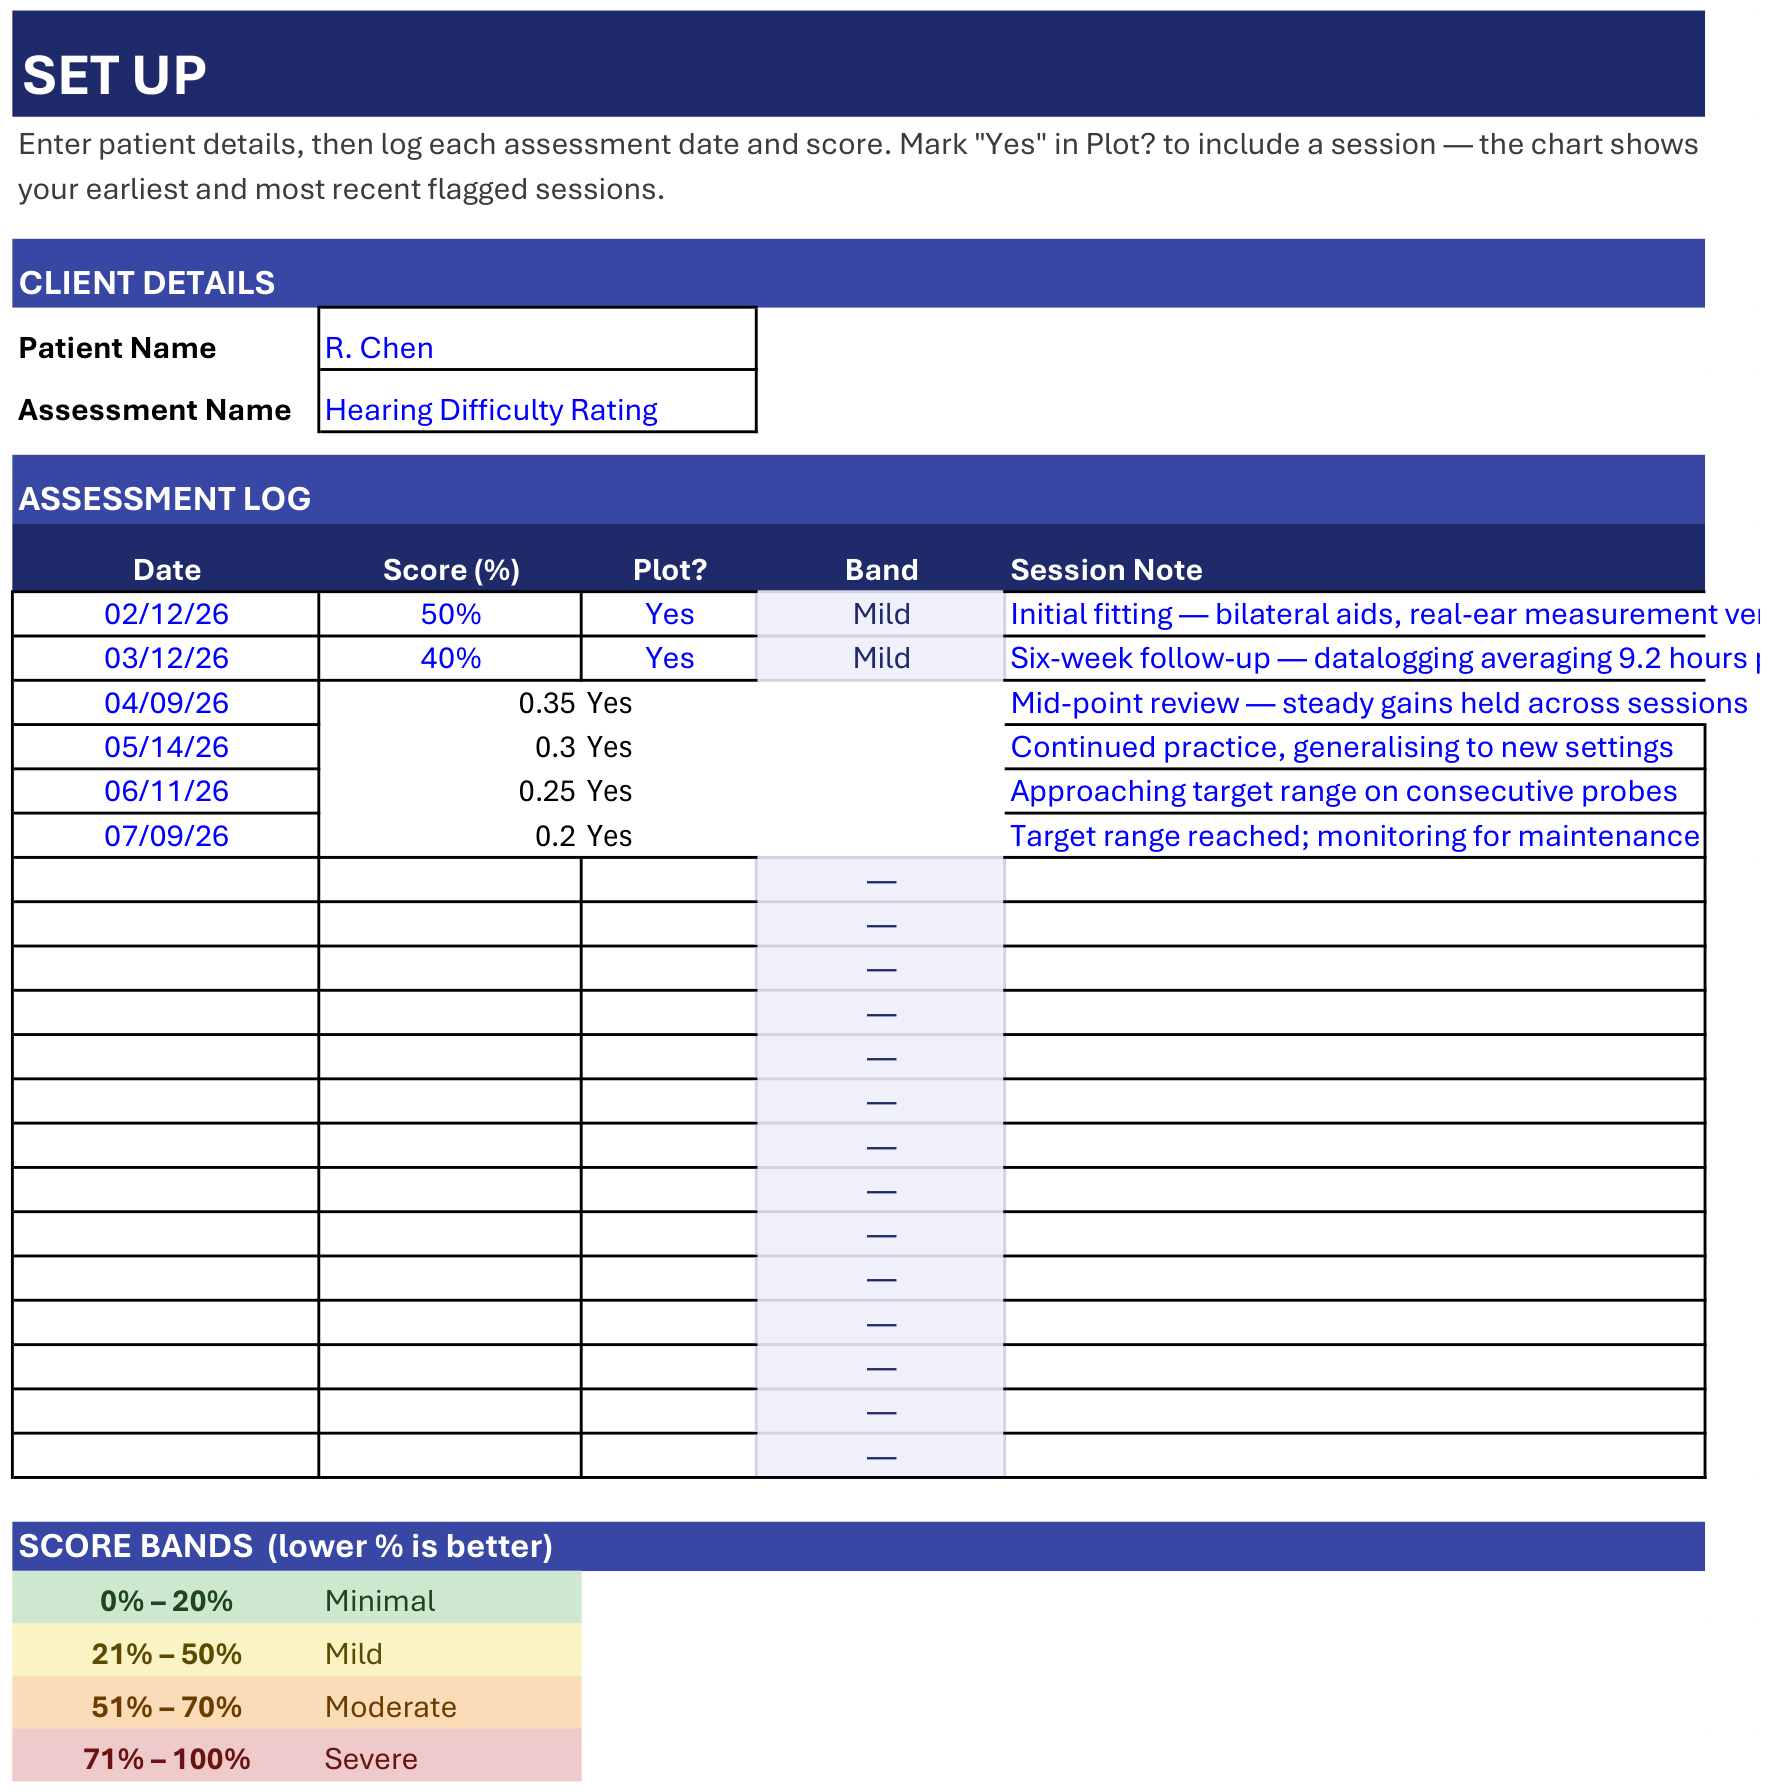
- A Plot? column so you decide which sessions count toward the chart
- Starting score, latest score, change and current band calculated on the dashboard
- A separate Dashboard GS tab spaced for Google Sheets, reading the same data
- Blank-when-blank throughout — empty fields show a dash, never an error
- Two files included: a working copy and a filled example to learn from
Every tab in the workbook
These are the actual sheet names in the file, not a feature list.
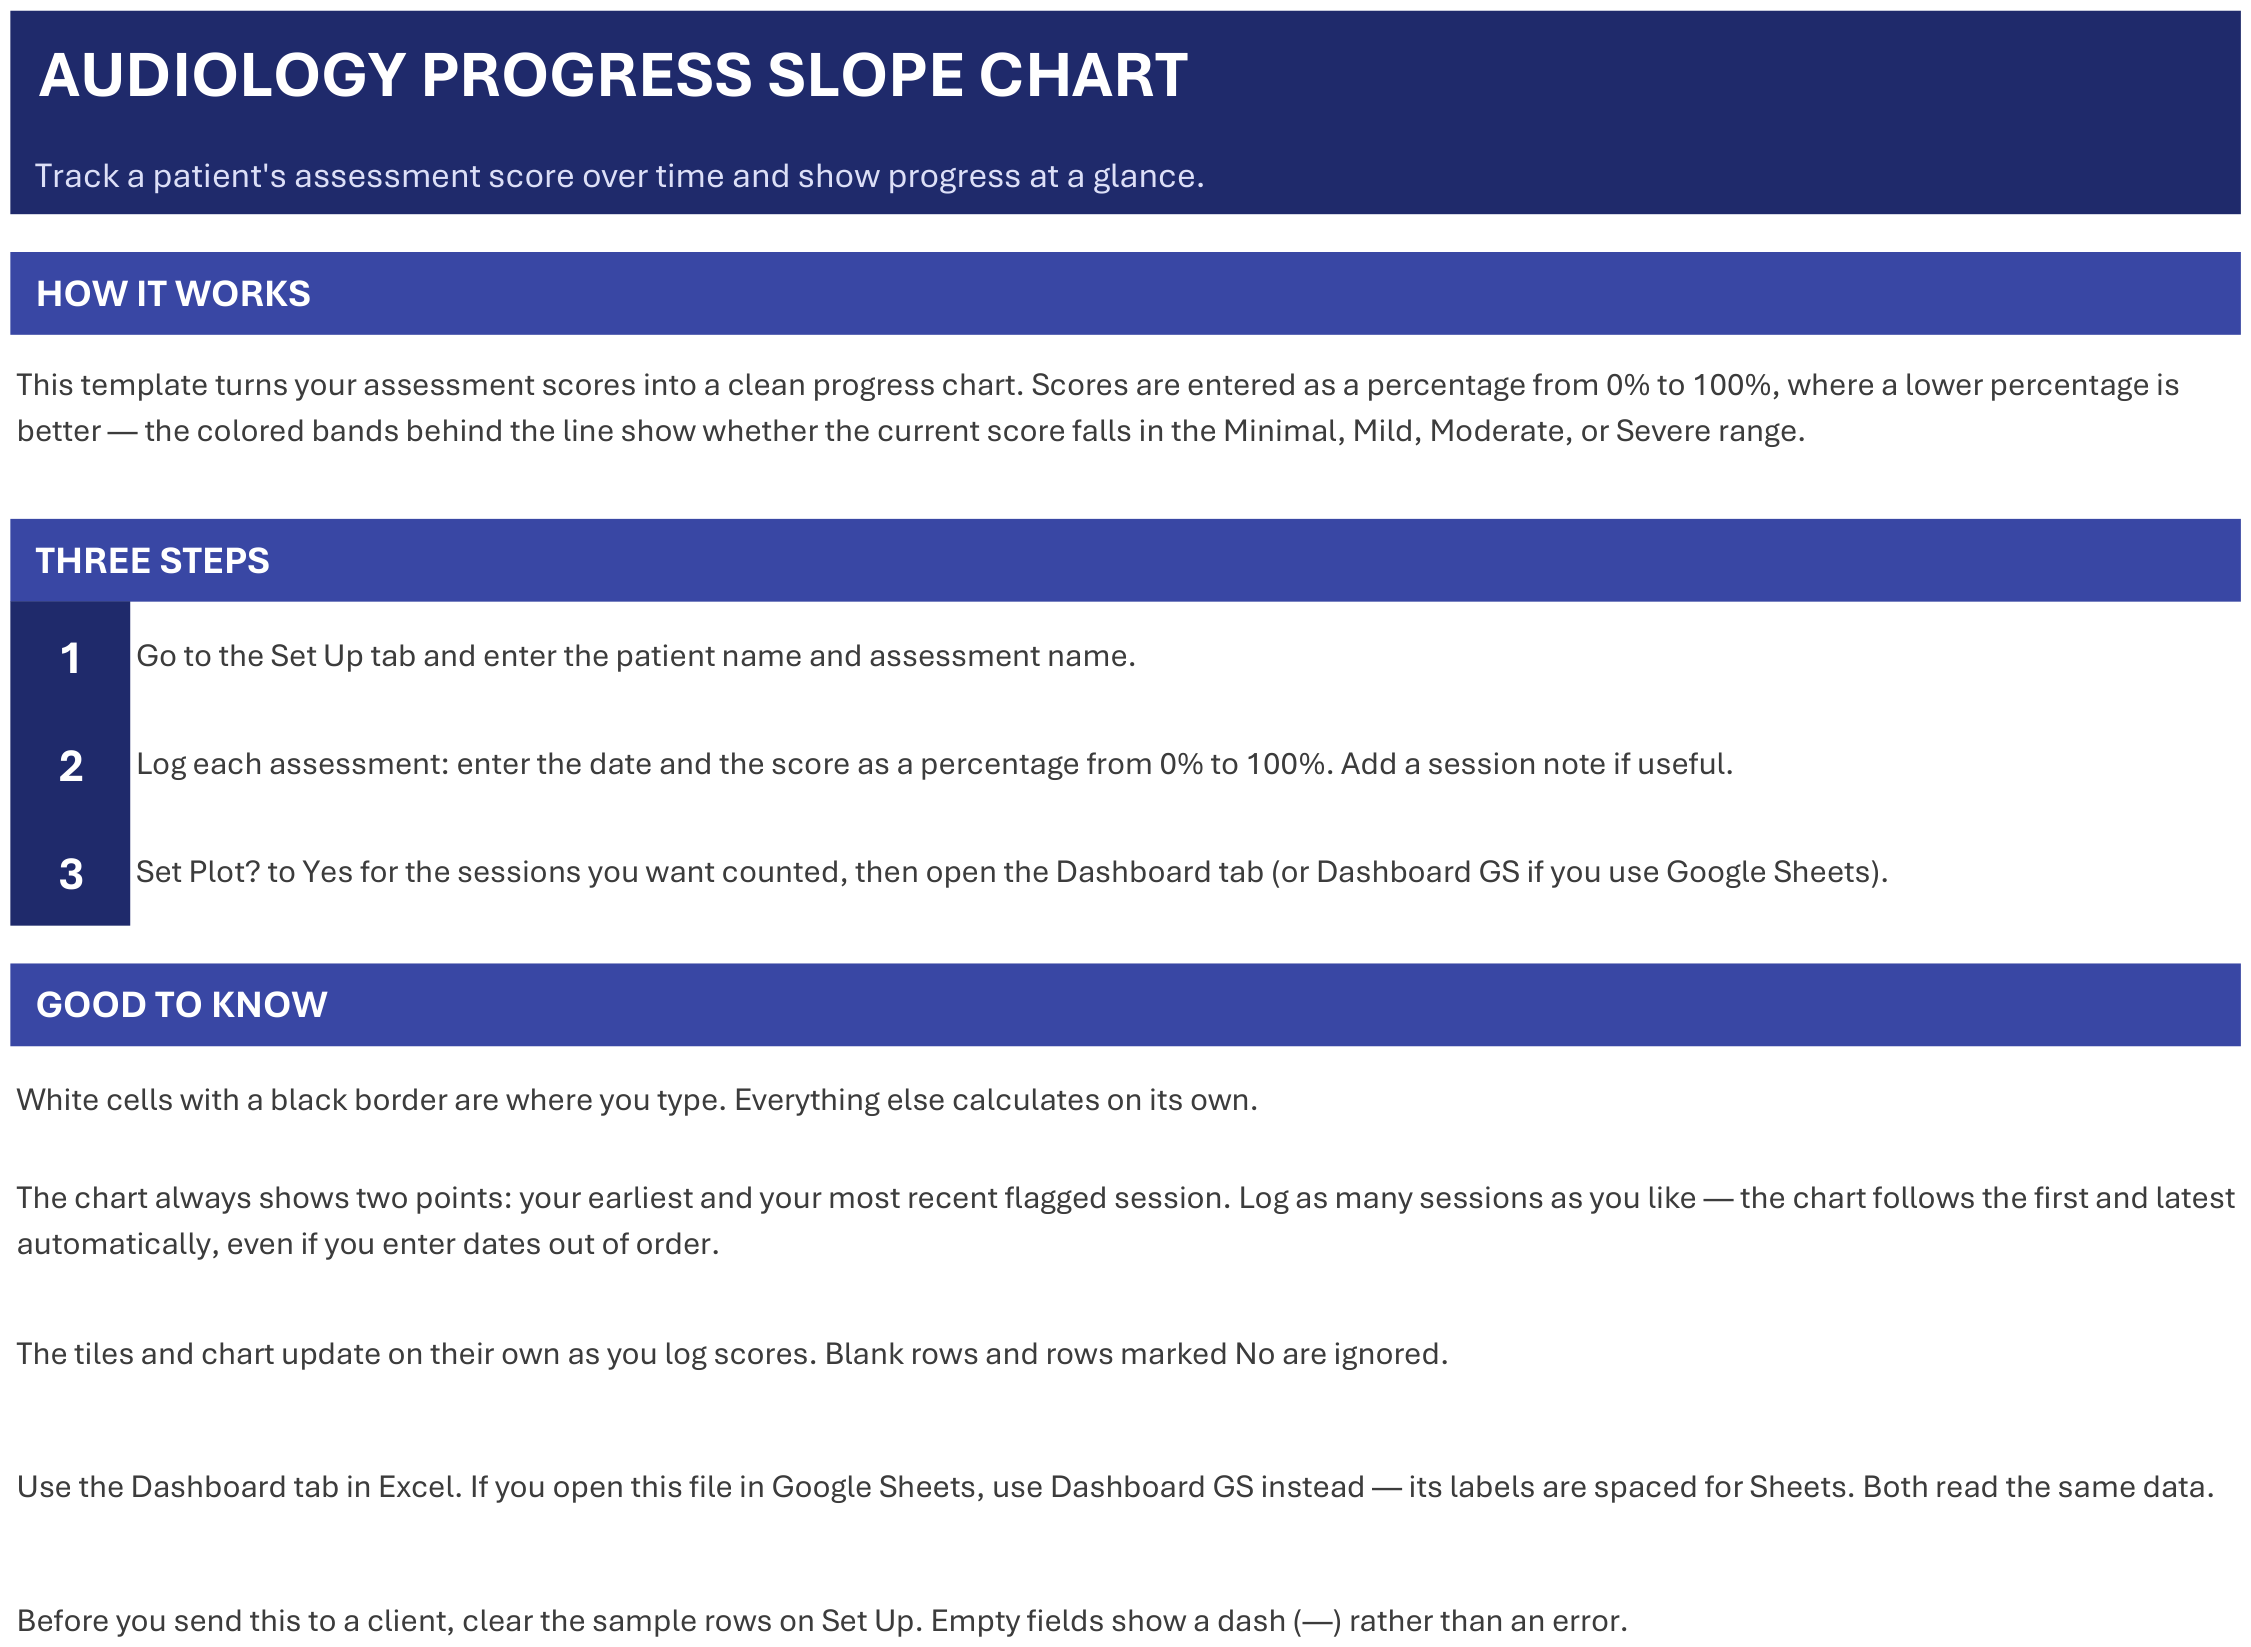
- Getting Started
- Set Up
- Dashboard
- Dashboard GS
What it looks like
Works in
- Microsoft Excel 2016 or later, Windows and Mac
- Google Sheets - upload to Drive and open
- No macros, no add-ins, no subscription
Honest scope
This is an organizational template. It reports the data you enter. It does not determine mastery, eligibility or compliance, and it does not replace your district or clinic documentation system - those stay your professional judgement.