Group Practice Clinician Productivity Dashboard
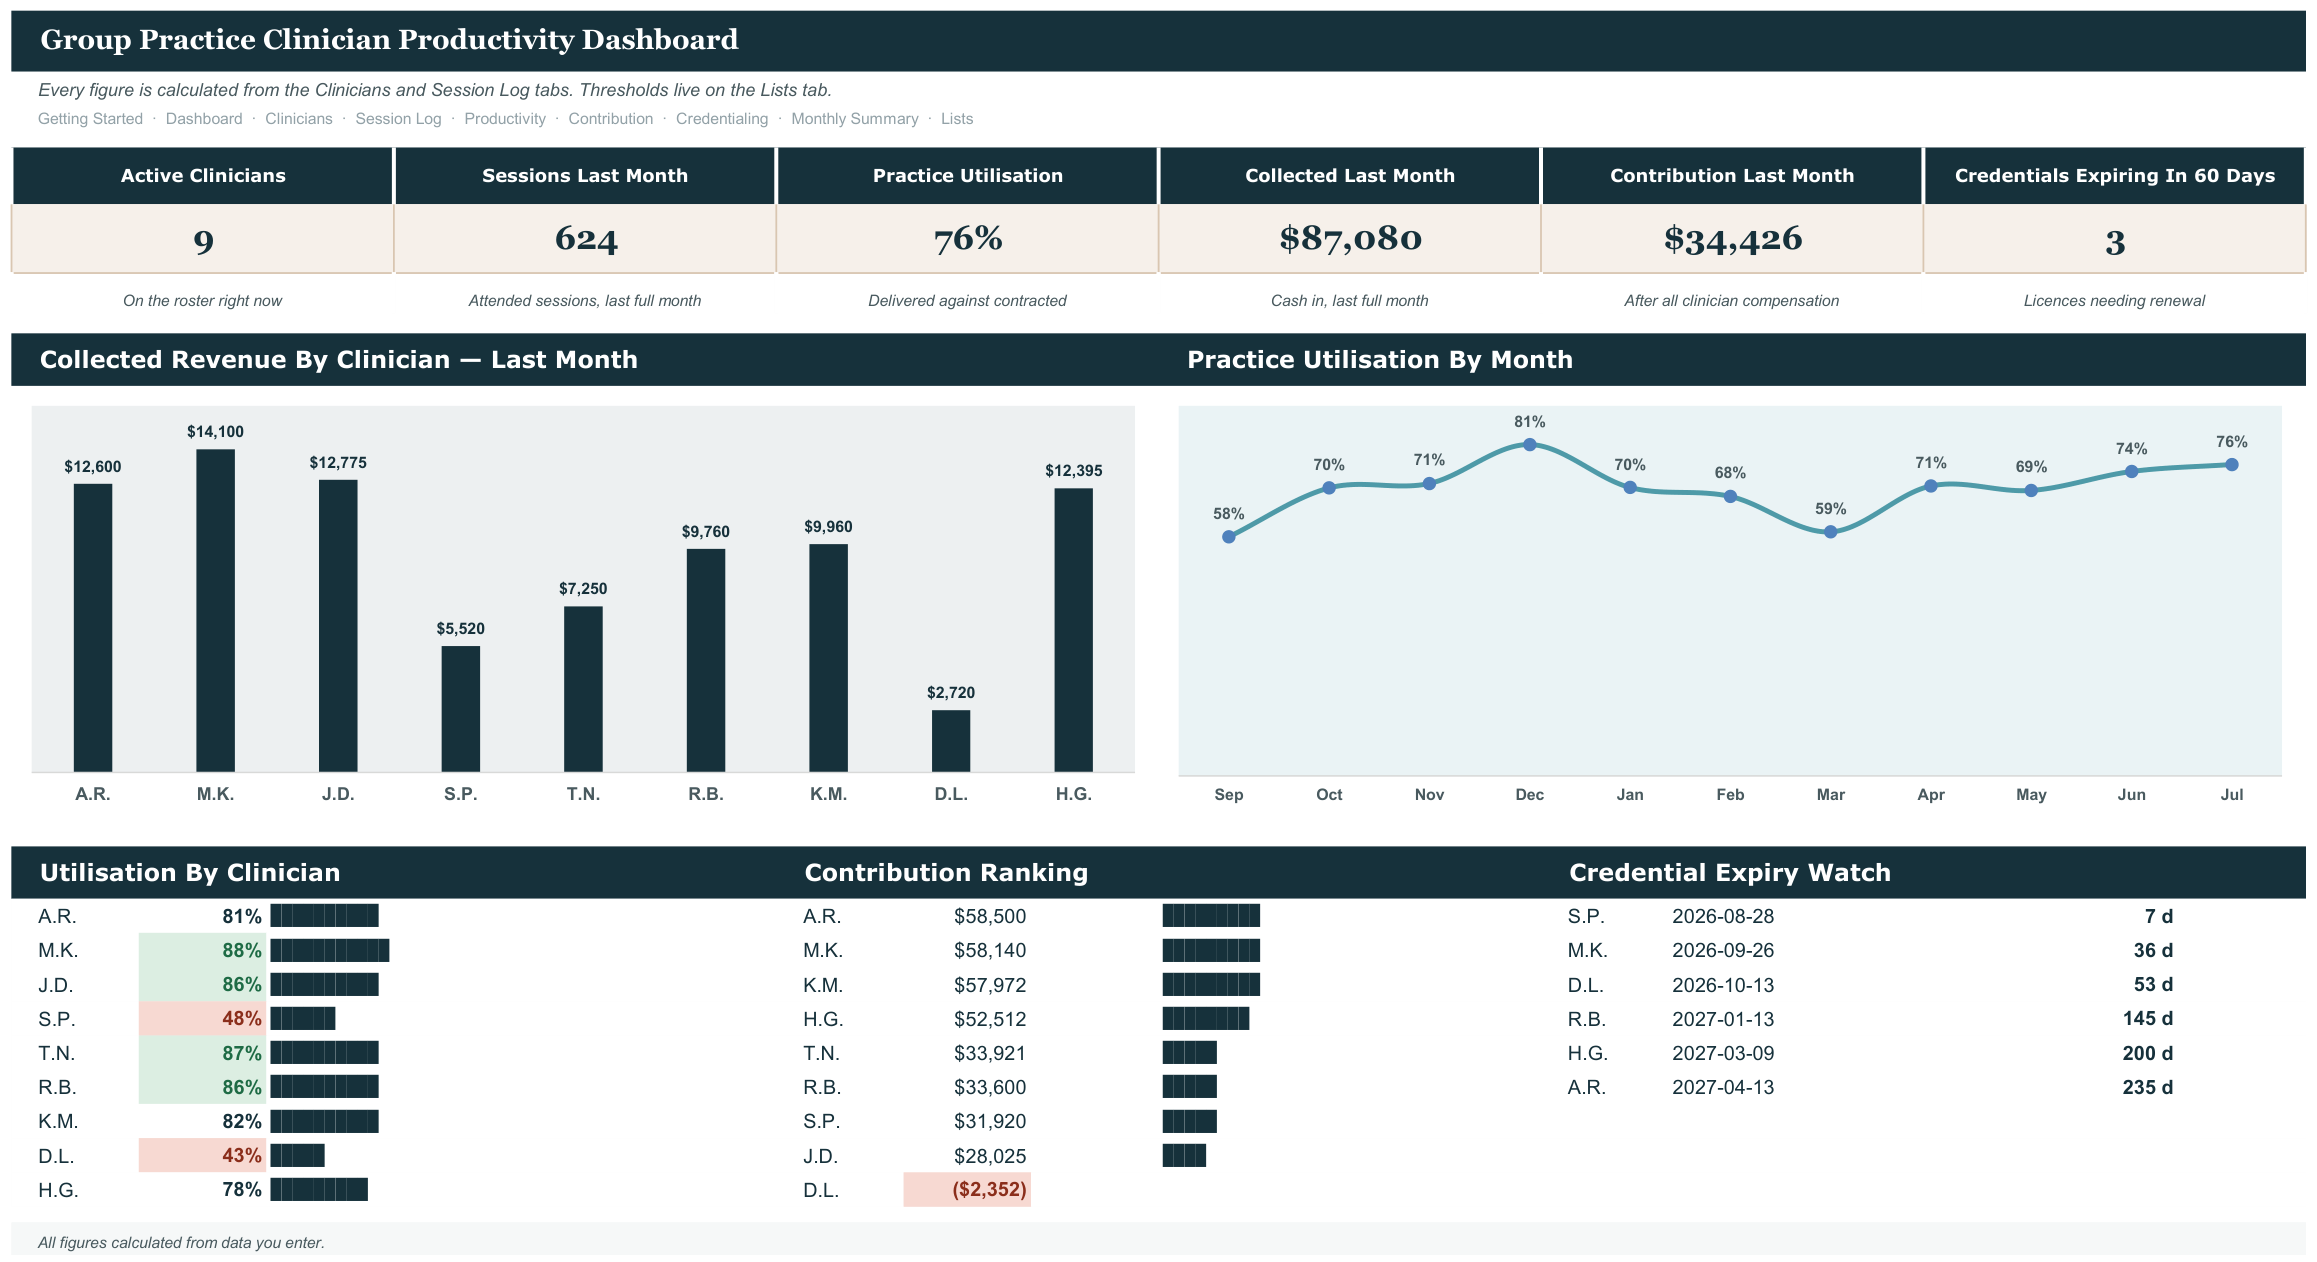
Per-clinician contribution margin. The owner's question is not 'how many sessions' but 'which clinicians are profitable after their split, and who is drifting below target'. The file computes billed, collected, clinician compensation at their split, and contribution per clinician per month, plus a caseload utilisation percentage against their contracted hours. It opens in Microsoft Excel and in Google Sheets, has no macros and nothing to install, and is reusable every school year.
What it does
- Per-clinician contribution margin.
- Built around the dates that actually bite: Monthly productivity targets, payroll periods, credentialing expiry dates per clinician.
- Clinicians tab
- Session Log tab
- Productivity tab
- Contribution tab
- Credentialing tab
- Monthly Summary tab
- Every threshold and dropdown editable on the Lists tab, nothing hardcoded
- Two files included: a blank workbook and a filled example to learn from
- Works in Excel and Google Sheets, no add-ons or macros
Every tab in the workbook
These are the actual sheet names in the file, not a feature list.
- Getting Started
- Dashboard
- Clinicians
- Session Log
- Productivity
- Contribution
- Credentialing
- Monthly Summary
- Lists
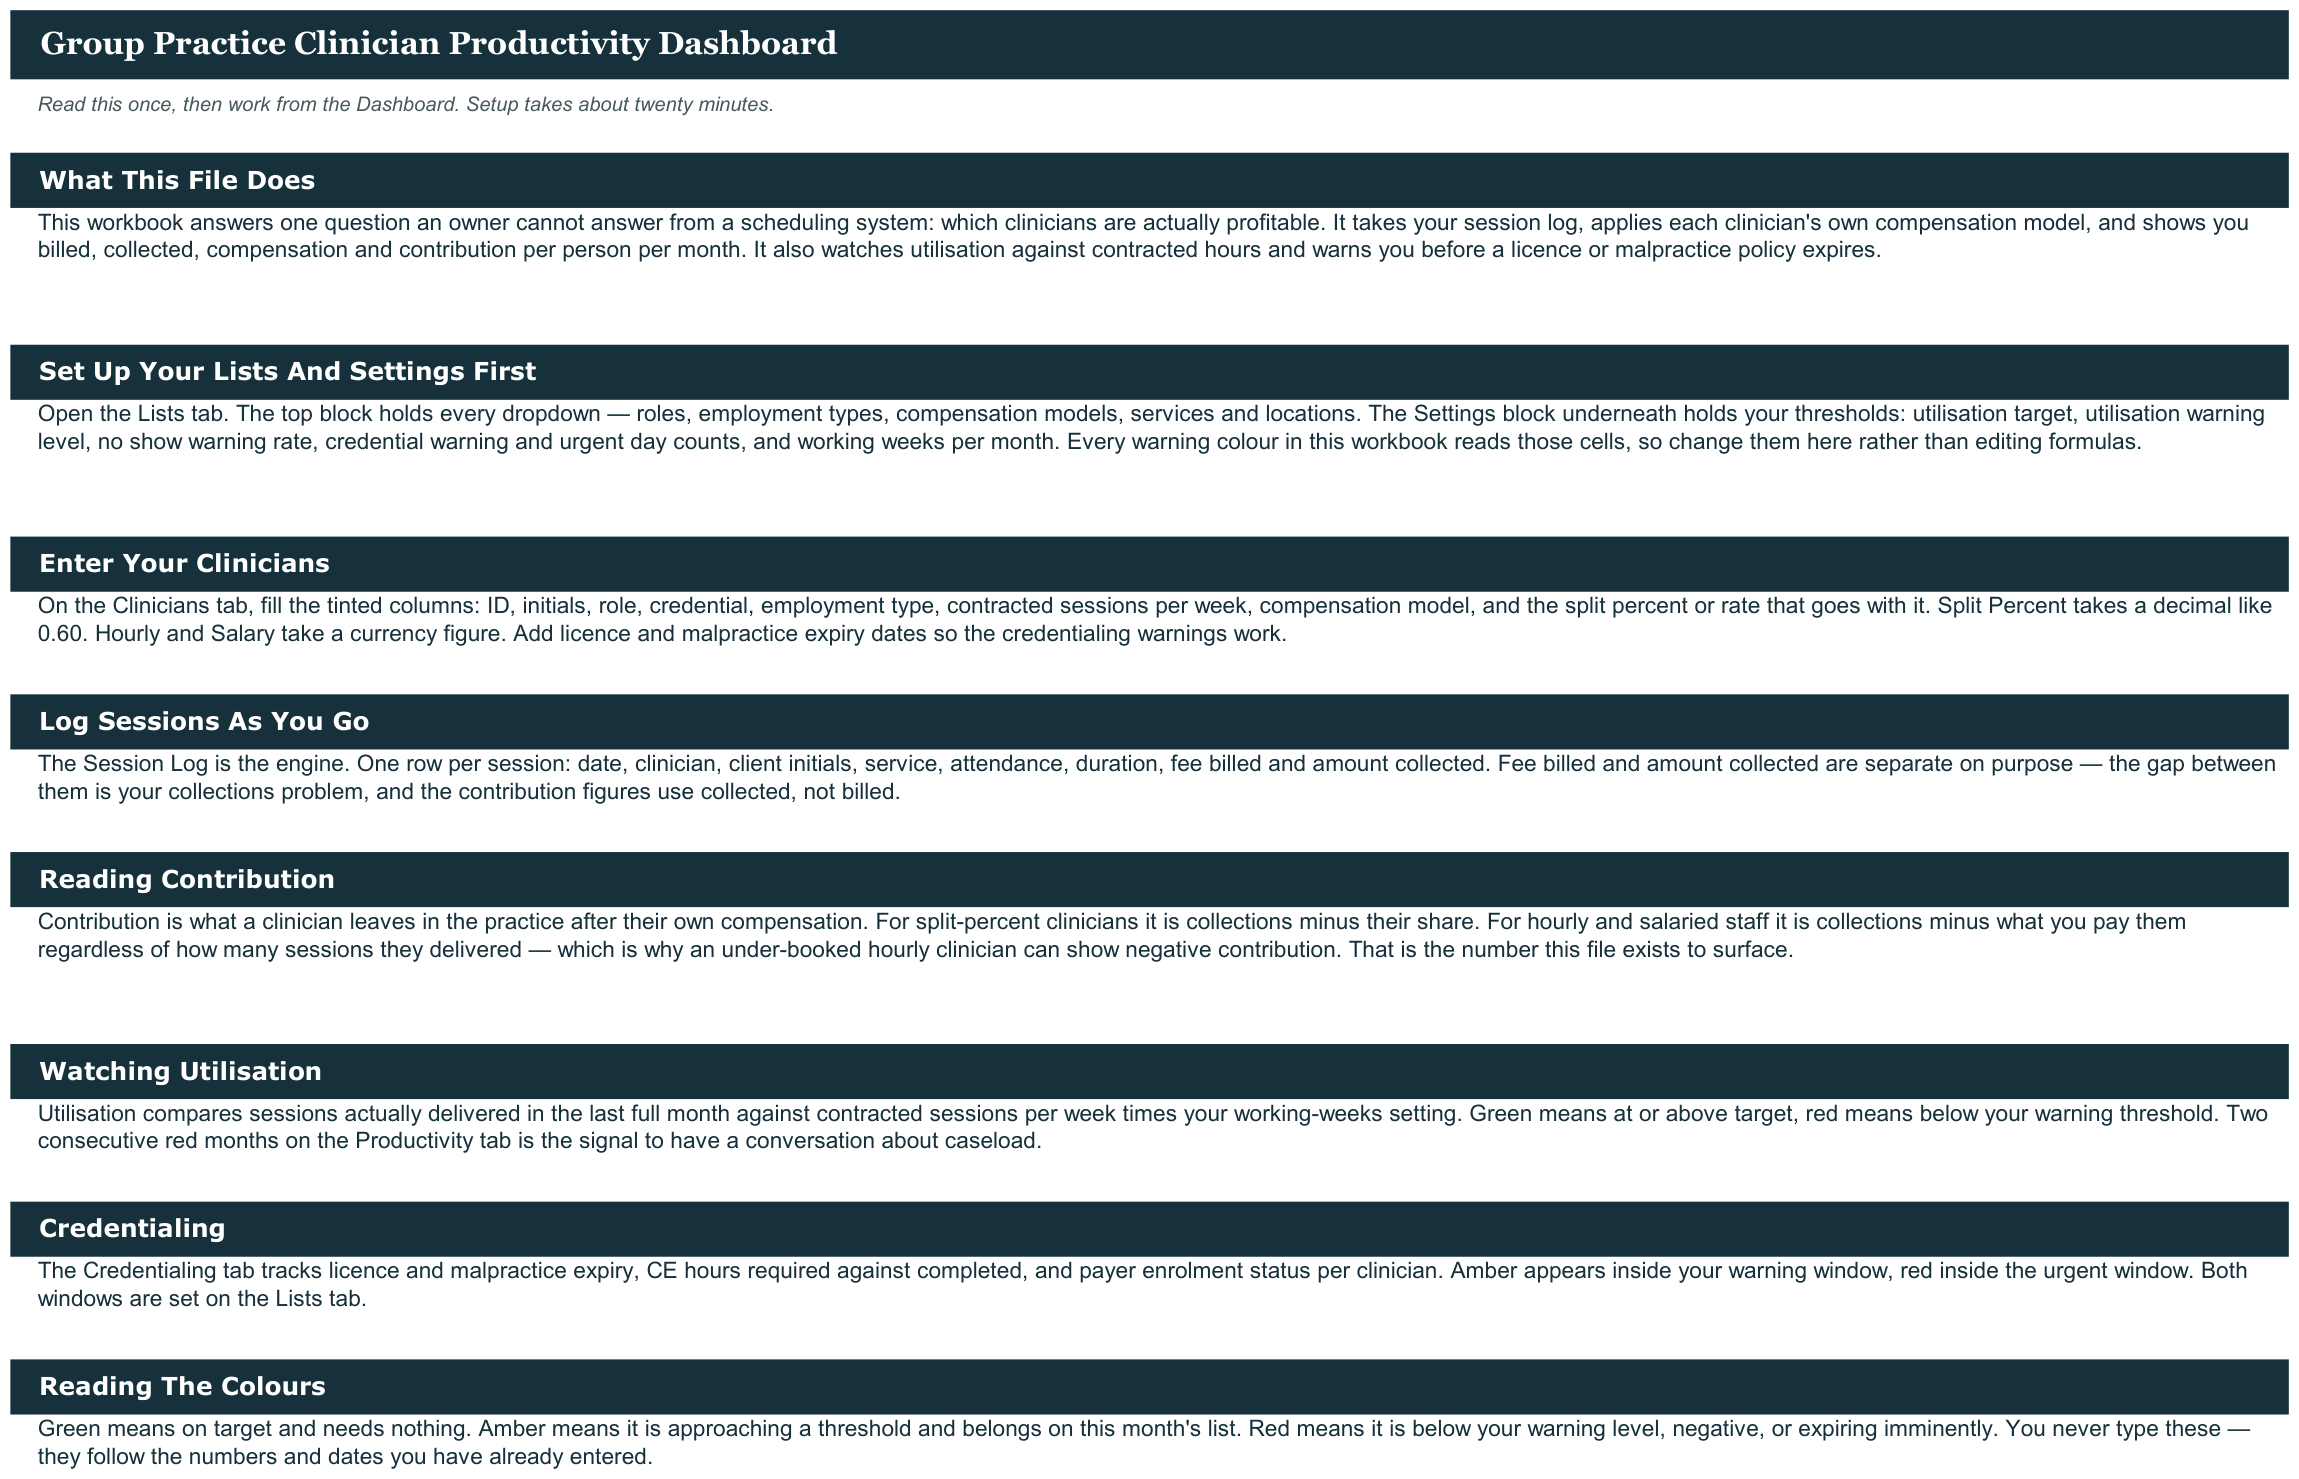
What it looks like

Works in
- Microsoft Excel 2016 or later, Windows and Mac
- Google Sheets - upload to Drive and open
- No macros, no add-ins, no subscription
Honest scope
This is an organizational template. It reports the data you enter. It does not determine mastery, eligibility or compliance, and it does not replace your district or clinic documentation system - those stay your professional judgement.