Therapy Practice Income and No Show Tracker
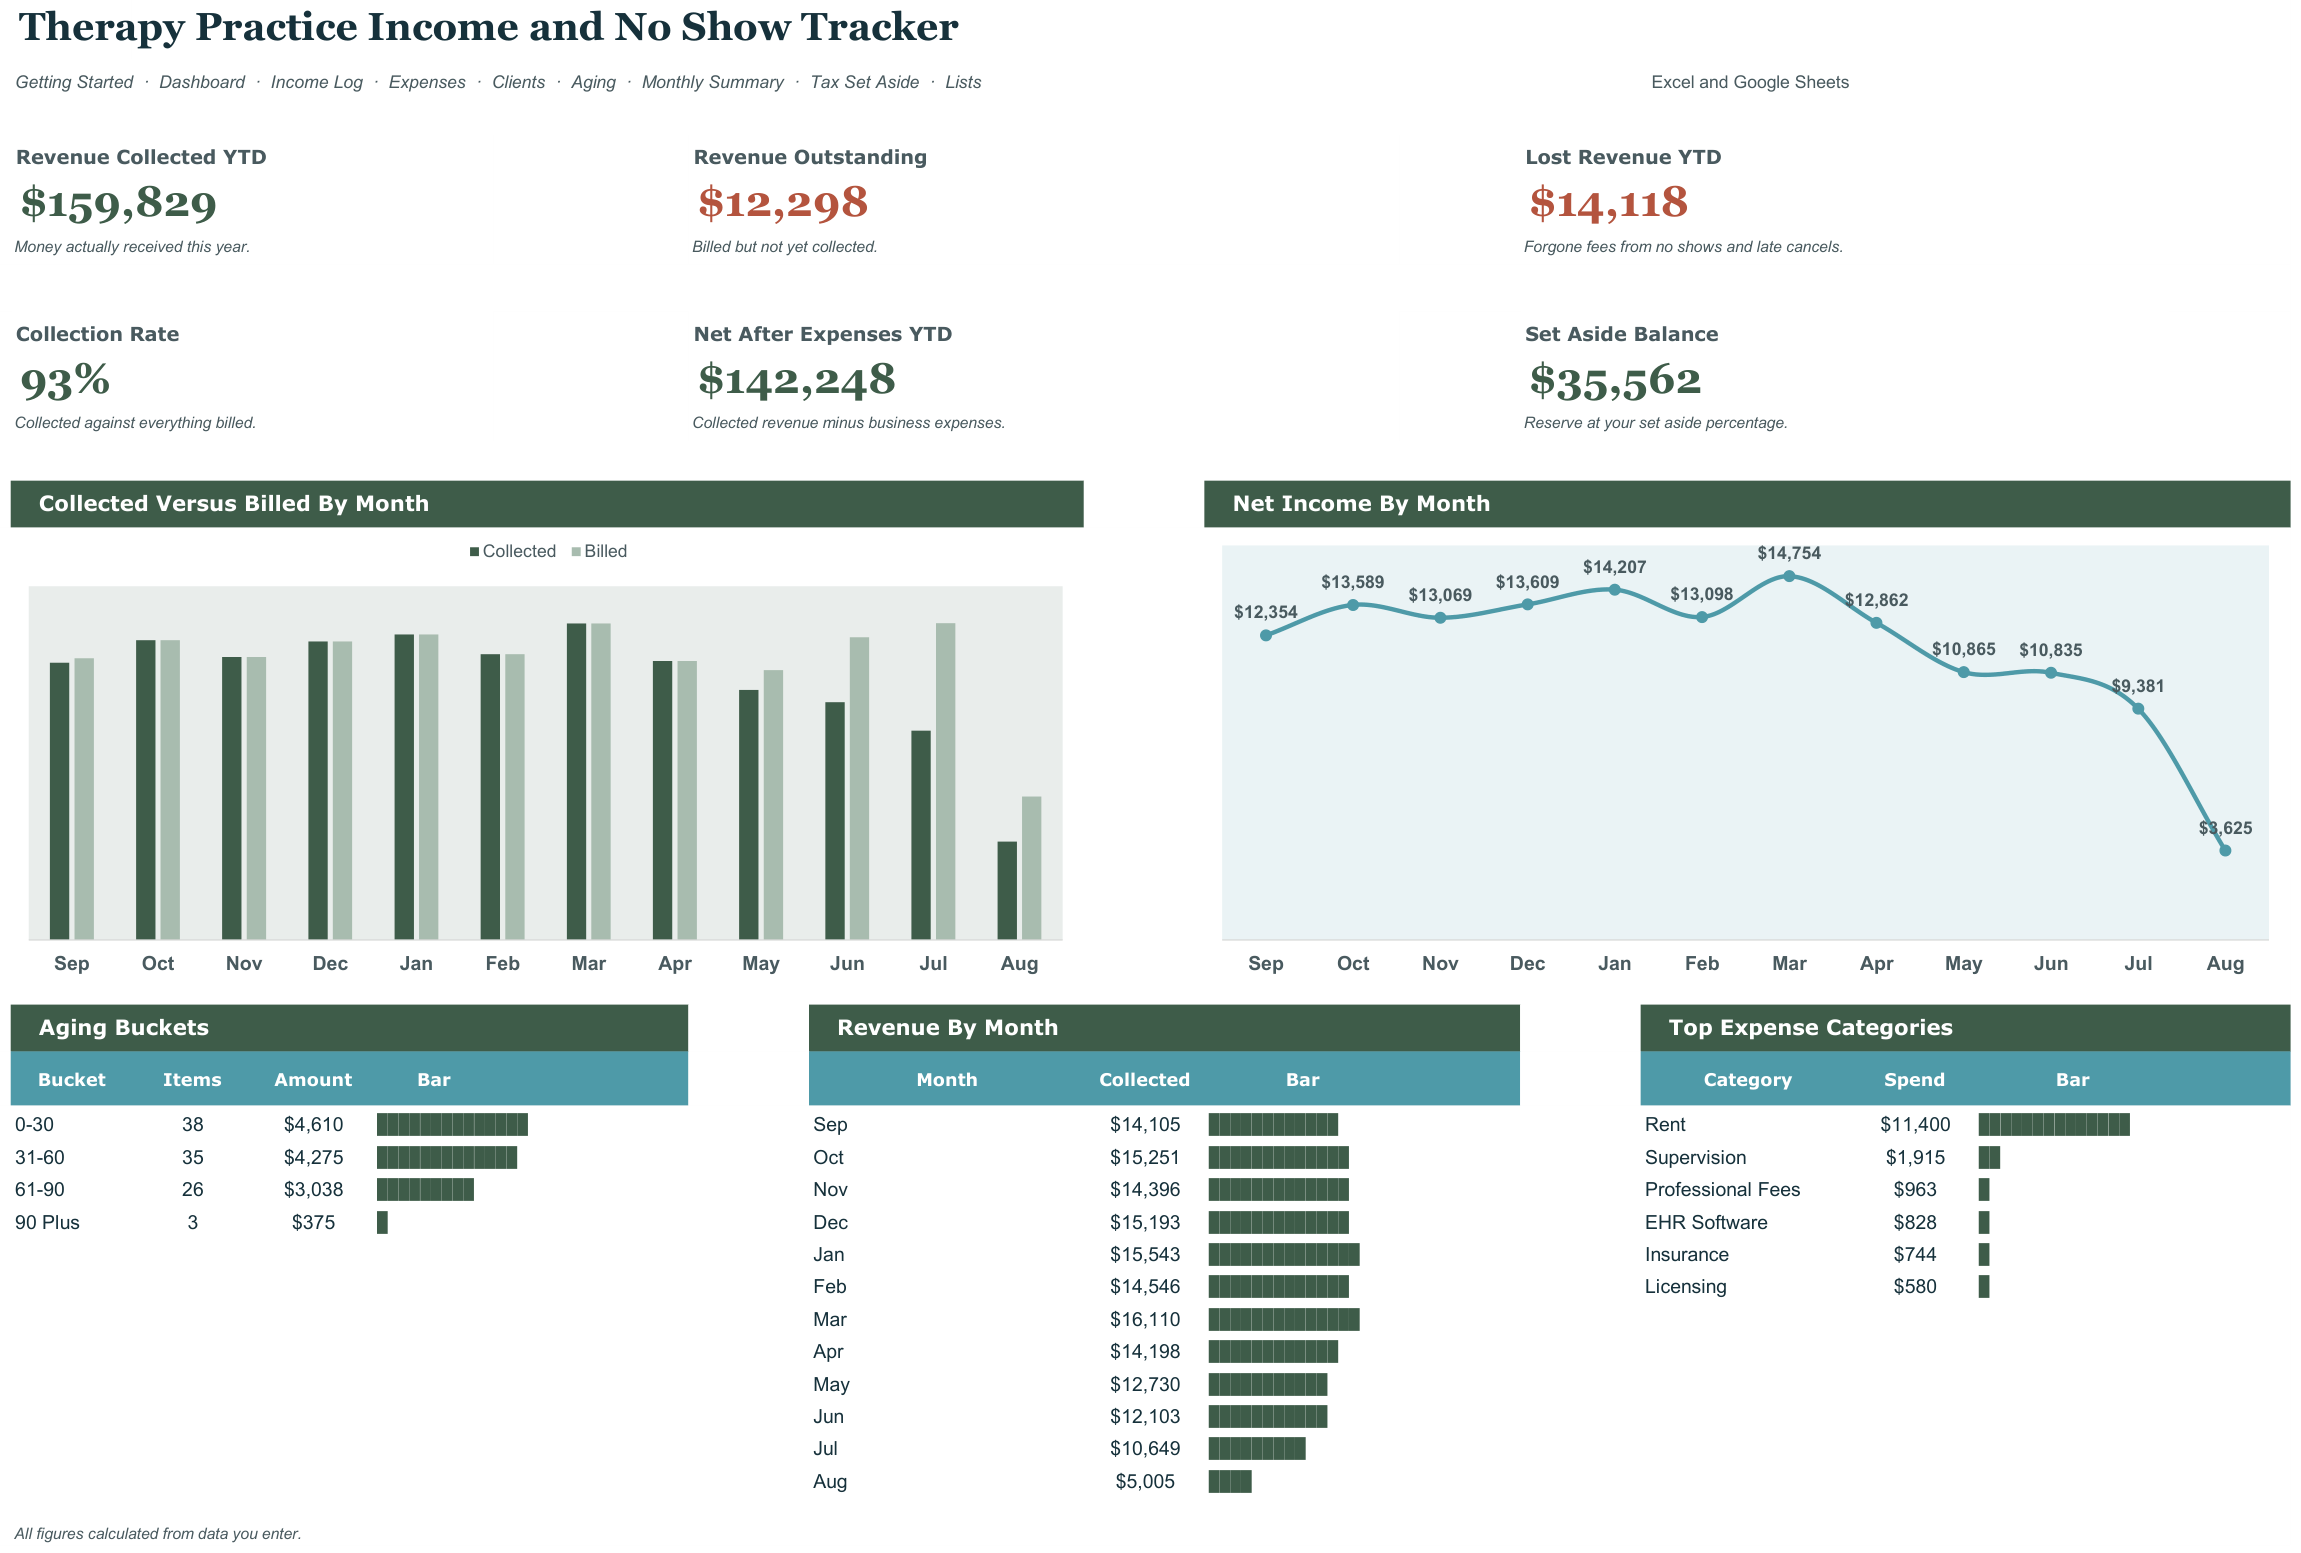
Revenue leakage quantified in dollars. The dashboard shows a single figure — lost revenue from no-shows and late cancellations this month and year to date — next to collected revenue. Practitioners feel that loss vaguely; seeing it as a number is the emotional hook that makes the listing convert. It opens in Microsoft Excel and in Google Sheets, has no macros and nothing to install, and is reusable every school year.
What it does
- Revenue leakage quantified in dollars.
- Built around the dates that actually bite: Monthly reconciliation, quarterly estimated tax set-aside, annual income review.
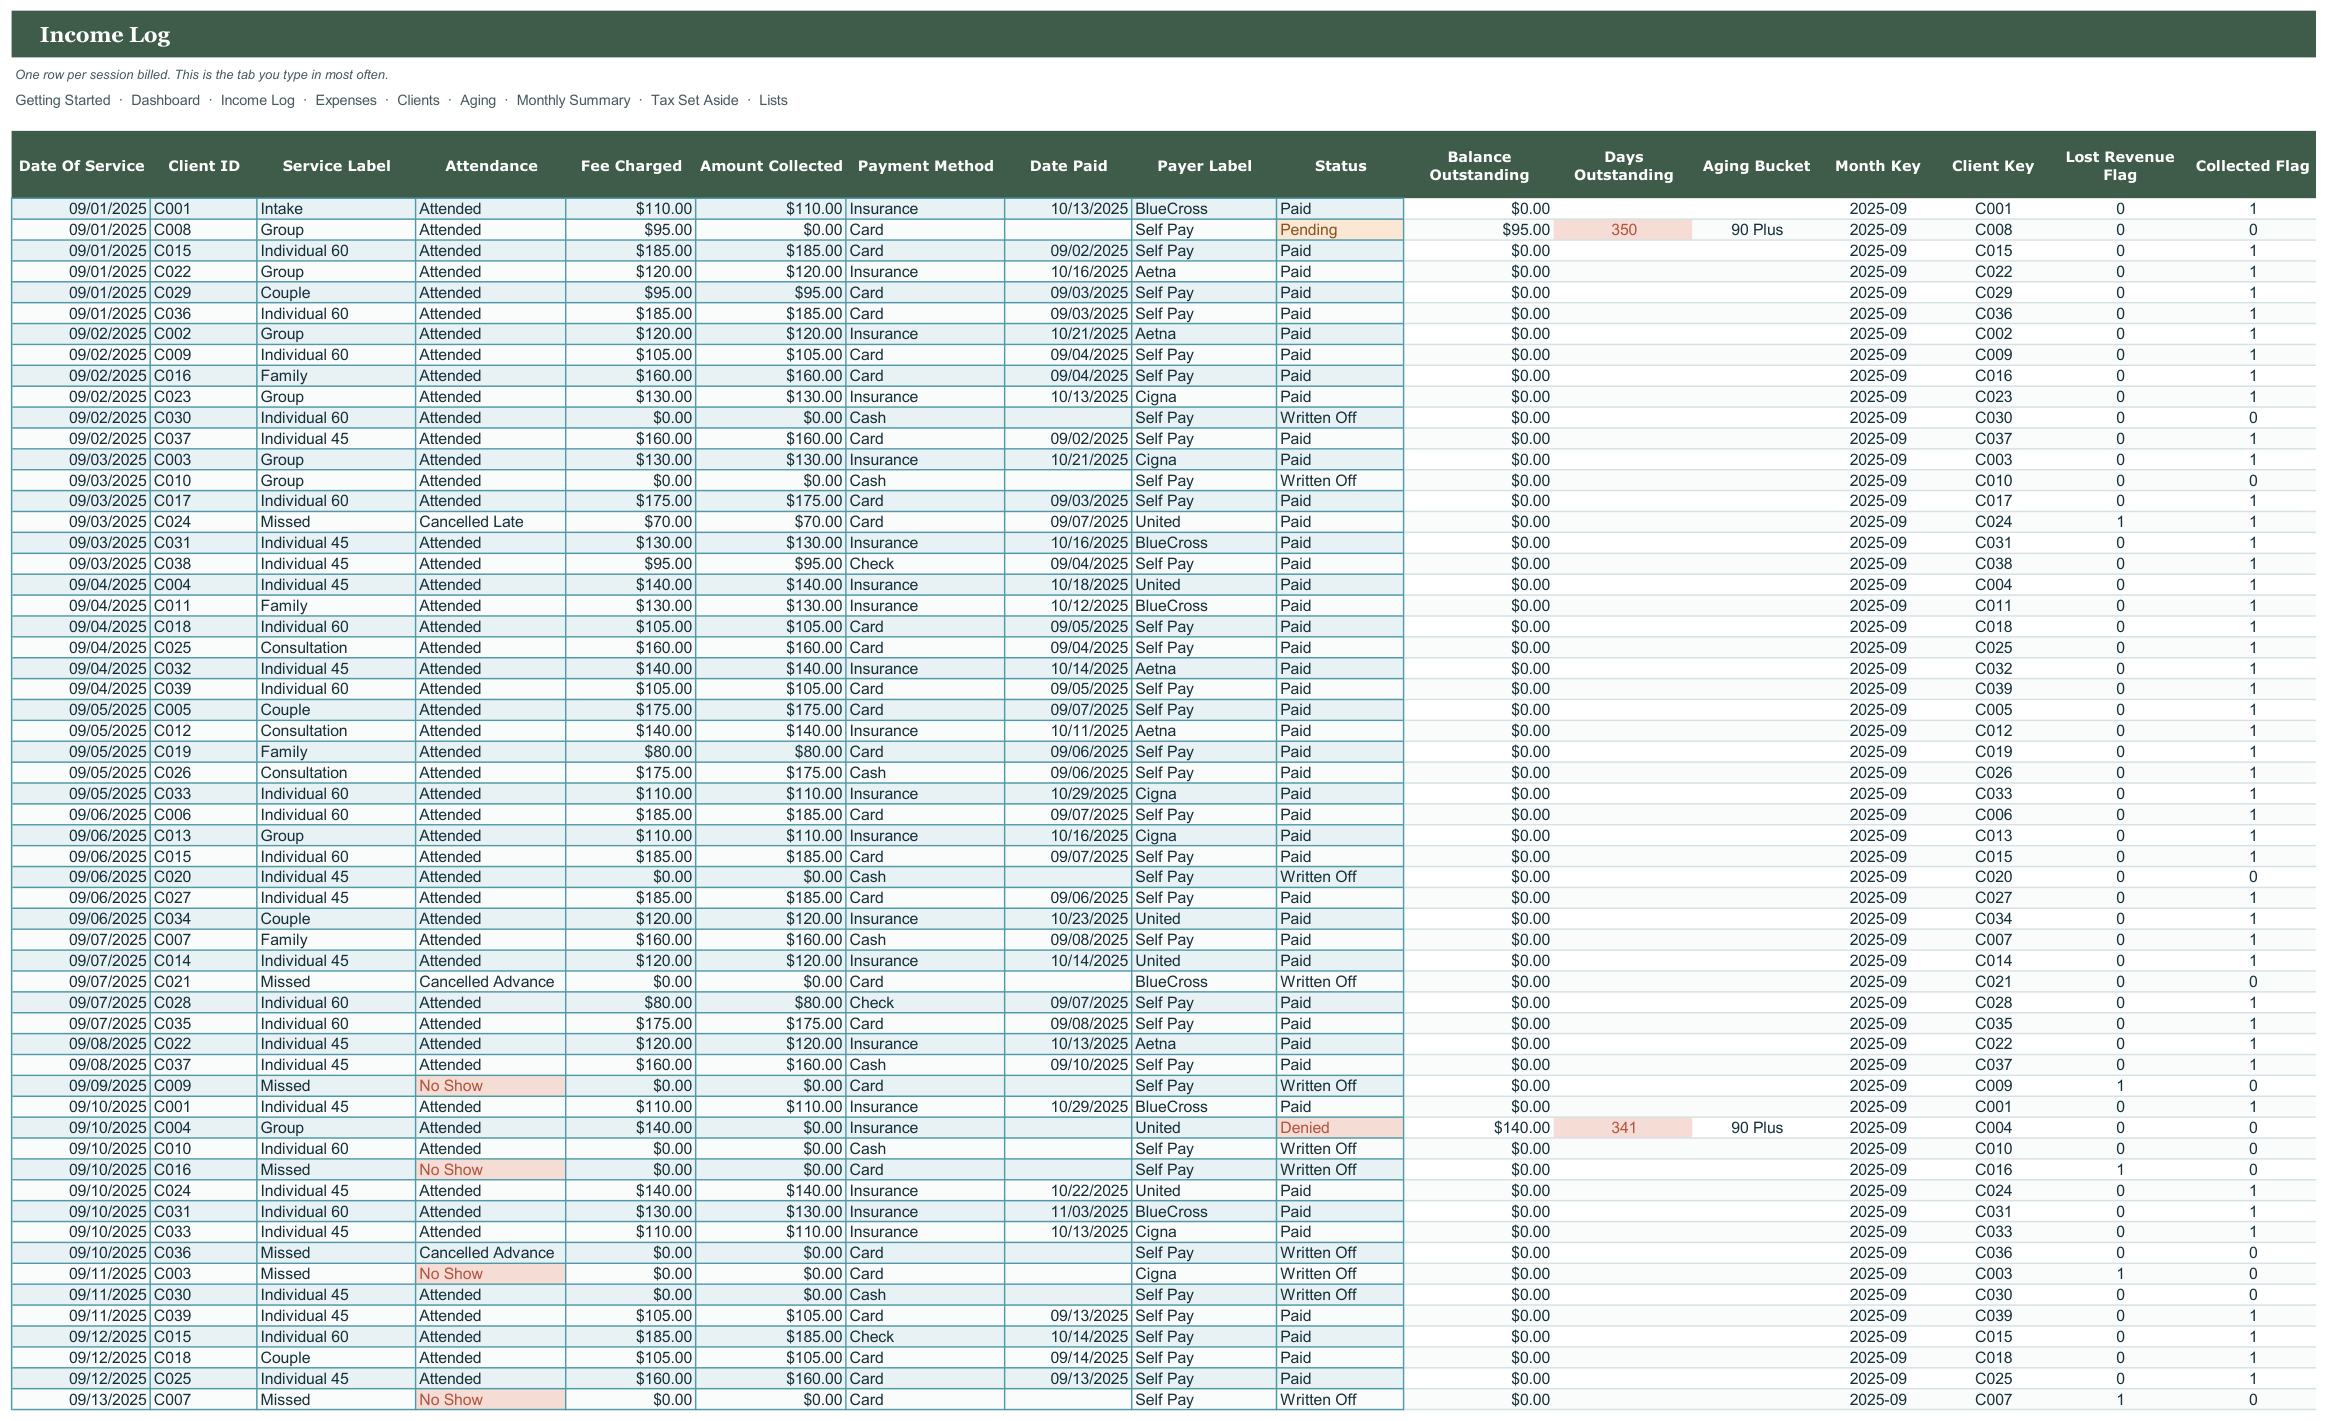
- Income Log tab
- Expenses tab
- Clients tab
- Aging tab
- Monthly Summary tab
- Tax Set Aside tab
- Every threshold and dropdown editable on the Lists tab, nothing hardcoded
- Two files included: a blank workbook and a filled example to learn from
- Works in Excel and Google Sheets, no add-ons or macros
Every tab in the workbook
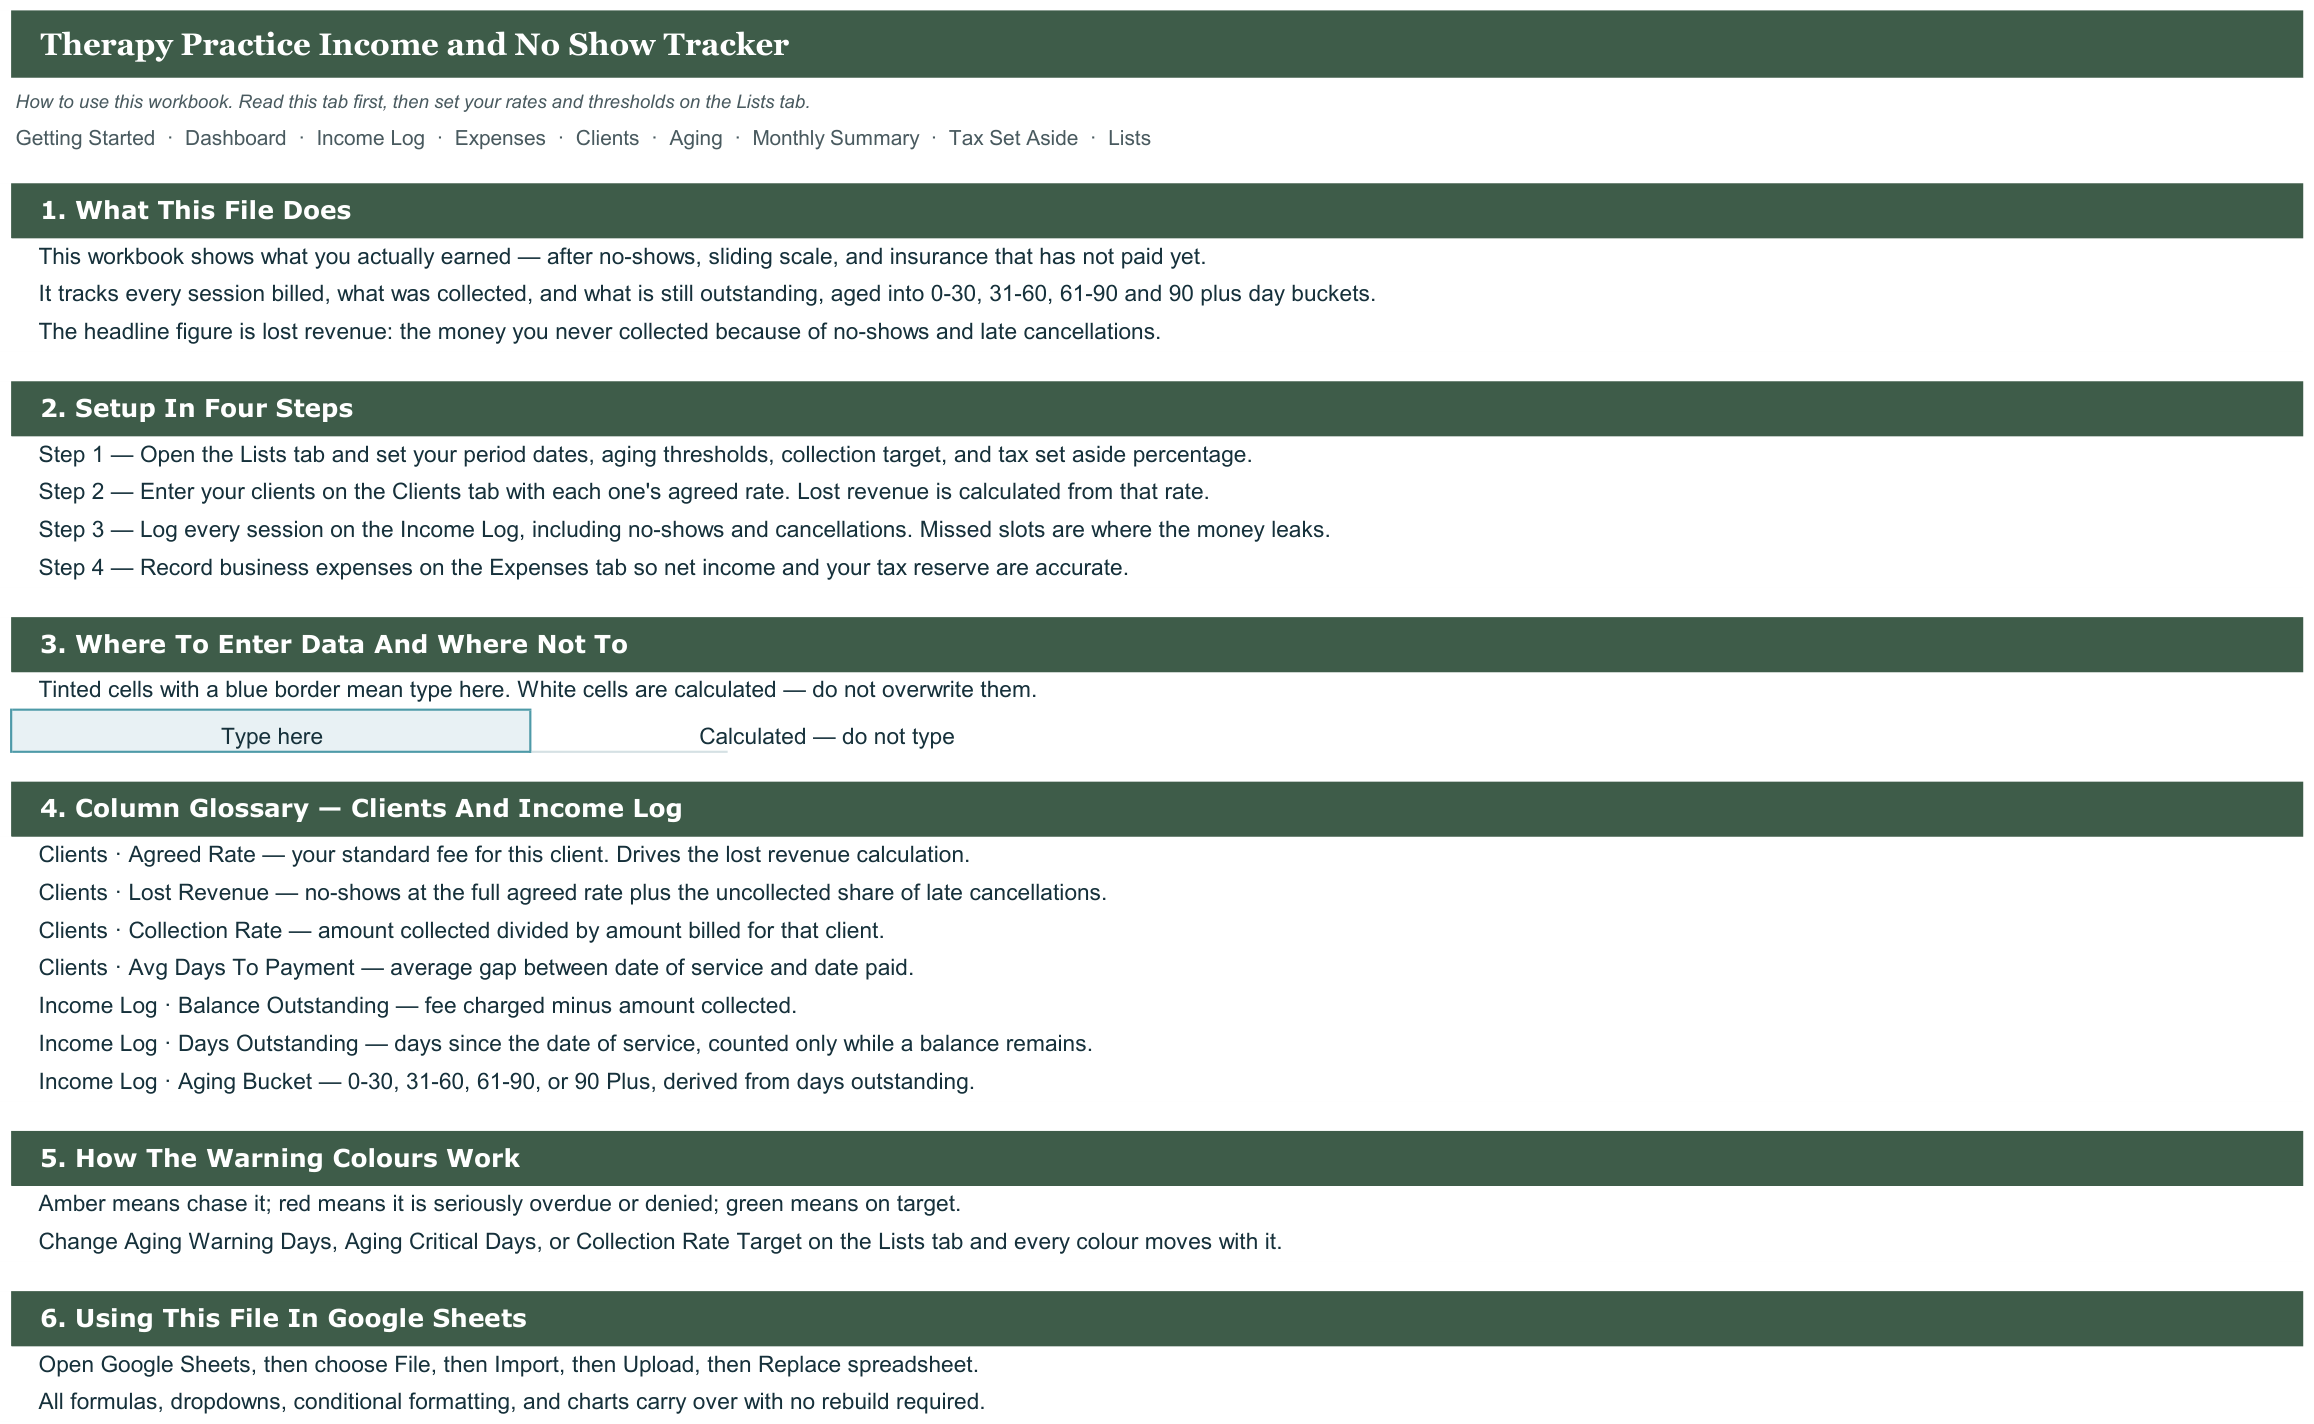
These are the actual sheet names in the file, not a feature list.
- Getting Started
- Dashboard
- Income Log
- Expenses
- Clients
- Aging
- Monthly Summary
- Tax Set Aside
- Lists
What it looks like
Works in
- Microsoft Excel 2016 or later, Windows and Mac
- Google Sheets - upload to Drive and open
- No macros, no add-ins, no subscription
Honest scope
This is an organizational template. It reports the data you enter. It does not determine mastery, eligibility or compliance, and it does not replace your district or clinic documentation system - those stay your professional judgement.