Home/Spreadsheets/School Psych & Support/Bell Curve Score Graph
Bell Curve Score Graph
A bell curve graph for evaluation reports: type each score once and the graph, the score table and a plain sentence for families are done. It opens in Microsoft Excel and in Google Sheets, has no macros and nothing to install, and is yours to reuse as often as you like.
What you get
- Up to 60 scores per student, each with a test or battery, a subtest or composite, a score type and the score
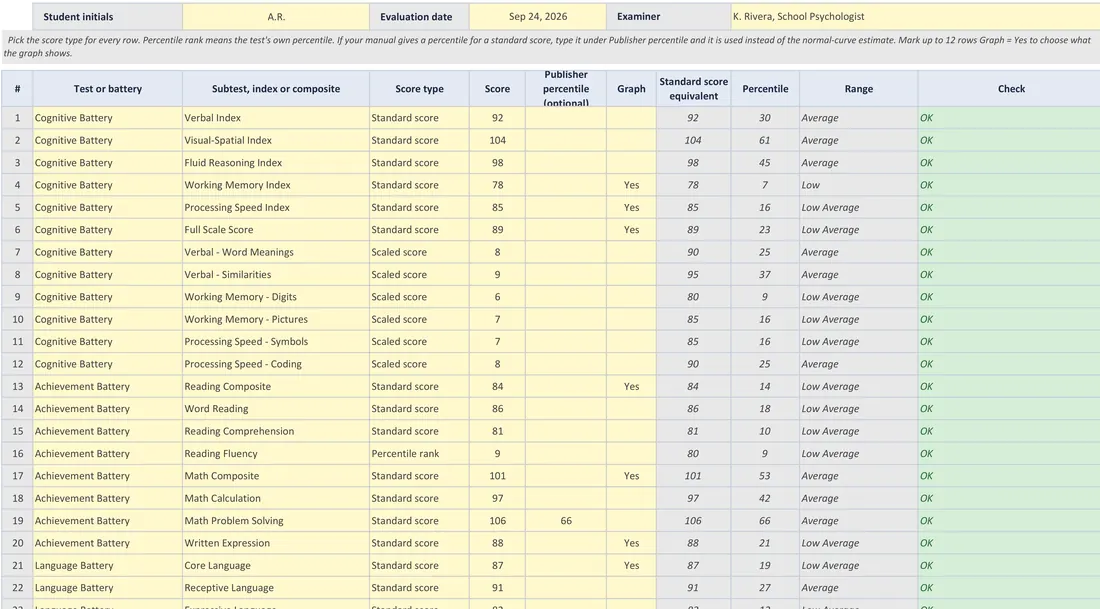
- Standard, scaled, T-score, z-score and percentile rank converted to one scale with a percentile and a range label
- Type the publisher's percentile from your manual and that value is used instead of the estimate
- Bell Curve with up to 12 numbered markers on a curve shaded by your classification ranges, plus a one-page Print Graph
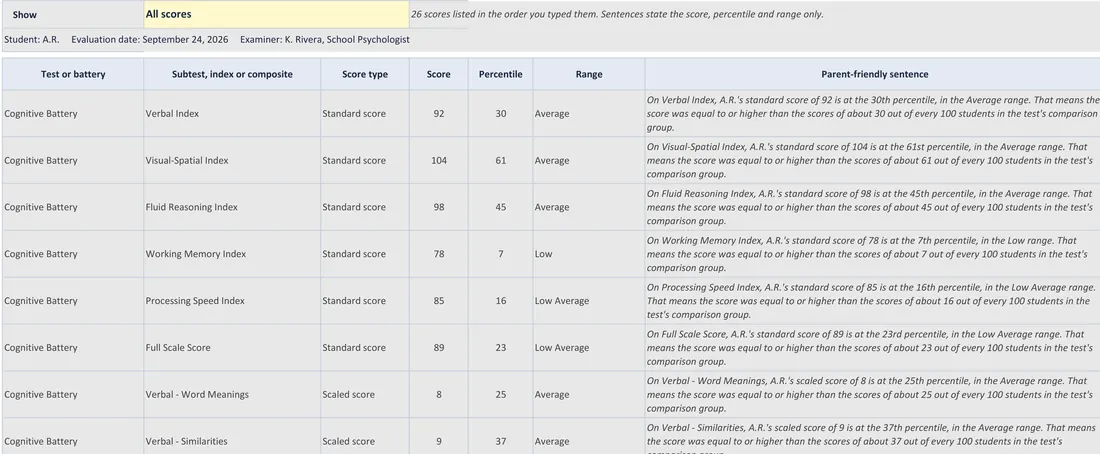
- Report Table with score, percentile and range, and one factual sentence per score that states the numbers only
- Opens in Excel and in Google Sheets
$9.99one-time, no subscription
Buy on Etsy
Instant digital download · one-time purchase · no subscription
What it does
- Up to 60 scores per student, each with a test or battery, a subtest or composite, a score type and the score
- Standard, scaled, T-score, z-score and percentile rank converted to one scale with a percentile and a range label
- Type the publisher's percentile from your manual and that value is used instead of the estimate
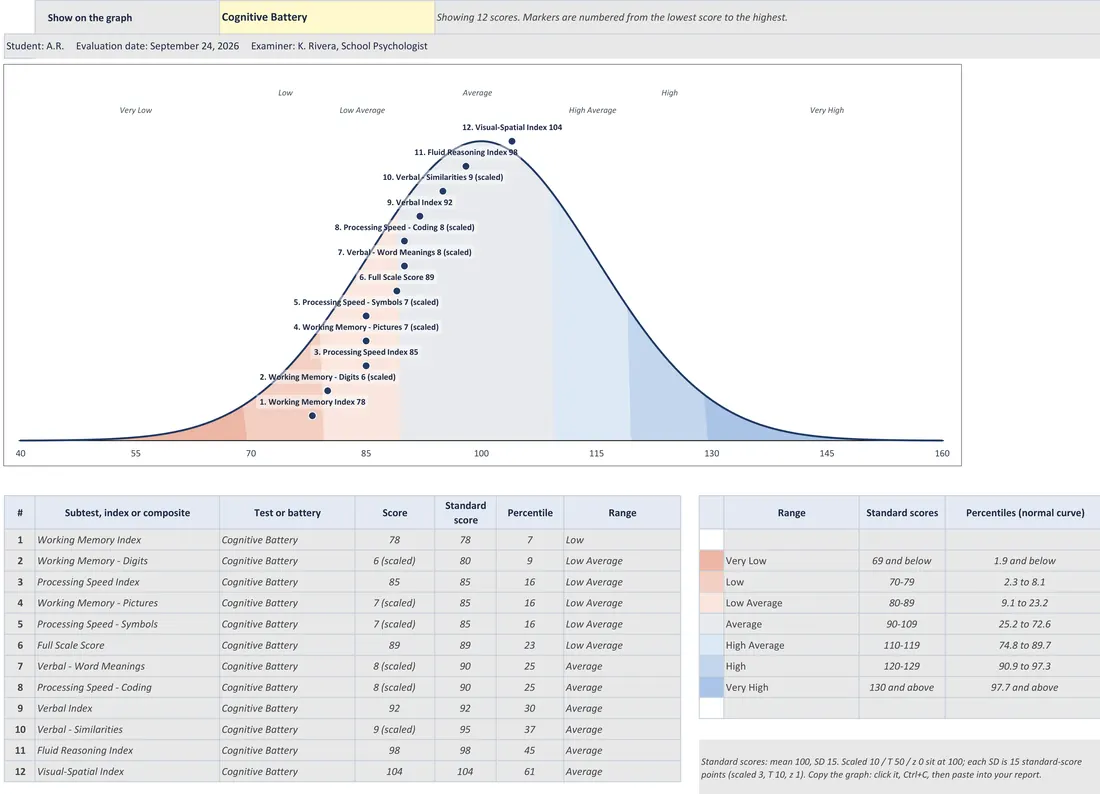
- Bell Curve with up to 12 numbered markers on a curve shaded by your classification ranges, plus a one-page Print Graph
- Report Table with score, percentile and range, and one factual sentence per score that states the numbers only
- Three ready classification schemes plus one to edit, because districts word their ranges differently
What it looks like
Every tab in the workbook
These are the actual sheet names in the file, not a feature list.
- Bell Curve
- Scores
- Report Table
Works in
- Microsoft Excel 2016 or later and Microsoft 365, Windows or Mac (markers show the score name and number)
- Google Sheets, free, in any browser (markers show their number; the table names each one)
- No macros, no add-ons
Honest scope
This is an organizational template. It reports the data you enter. It does not determine mastery, eligibility or compliance, and it does not replace your district documentation system — those stay your professional judgement.
Others in School Psych & Support
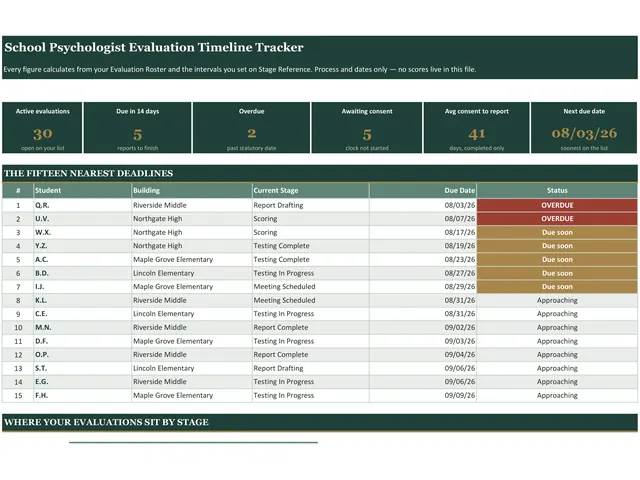
- School Psychologist Evaluation Timeline TrackerEvery evaluation from referral to report to meeting, on one page, with the days…$14.99View →
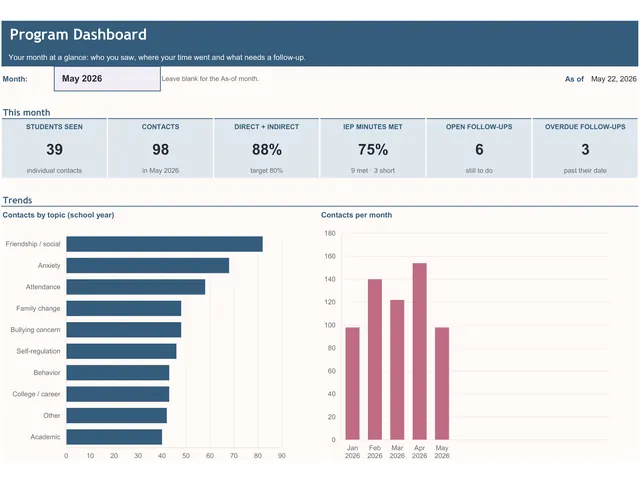
- School Counselor TrackerA school counselor tracker: log a student contact in seconds and have IEP counseling…$16.99View →
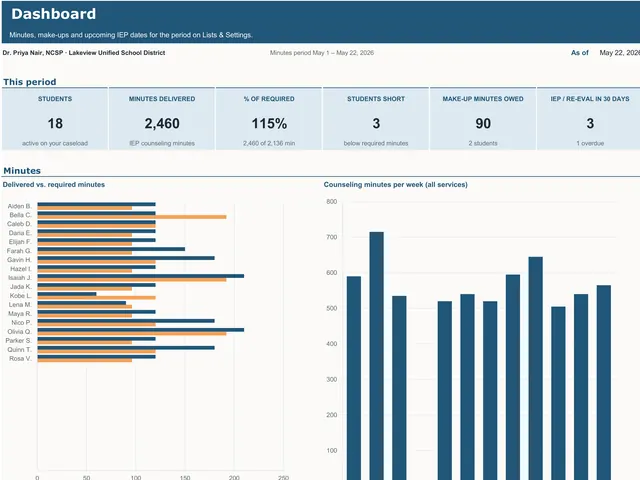
- School Psychologist Caseload TrackerA school psychologist caseload tracker for IEP counseling minutes, make-ups and IEP…$17.99View →
- School Social Worker Caseload TrackerA school social worker caseload tracker: log contacts, IEP service minutes, home visits…$16.99View →